
Average Height in the US (CDC 2026 Update)
Height is one of the most searched physical traits in the United States. People want to know how they compare to others, whether their child is growing normally, or simply what counts as “average.” If you’re wondering about average height in the US, the answer depends on the group being measured. National health surveys, however, give us a consistent picture. Below, we break down average American heights for men, women, teenagers, children, and babies; show where each falls as a percentile; and explain why different sources quote slightly different numbers.
Key Takeaways
What Is the Average Height in the US?
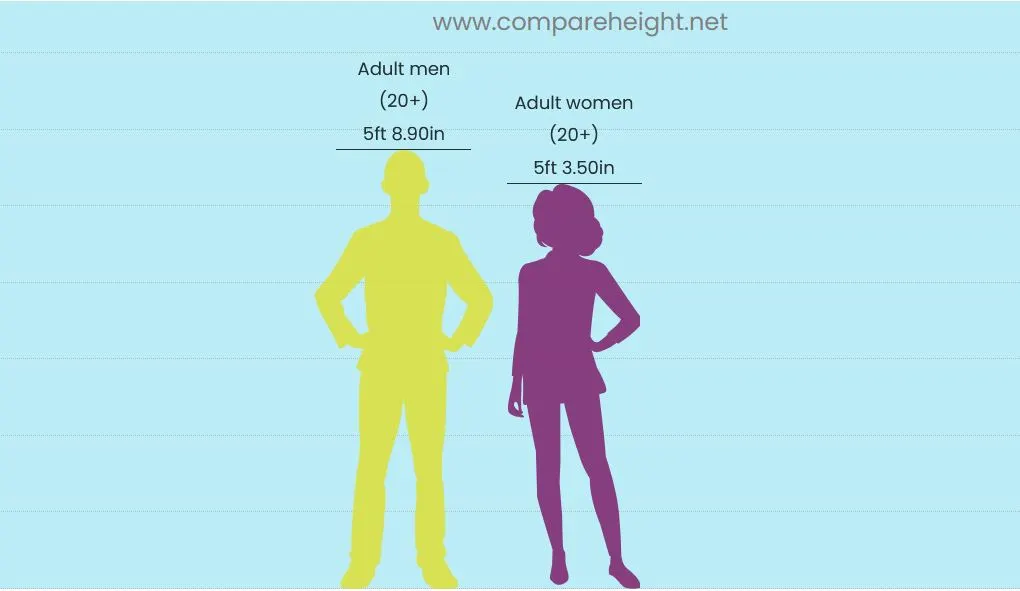
The average height in the United States is just under 5’9″ (175.1 cm) for adult men and 5’3.5″ (161.2 cm) for adult women, based on CDC measurements of adults aged 20 and over. Measured at peak height around age 19–20, Americans average slightly taller.
Group | Average height | Metric |
|---|---|---|
Adult men (20+) | 5’8.9″ | 175.1 cm |
Adult women (20+) | 5’3.5″ | 161.2 cm |
Difference | 5.5 inches | 13.9 cm |
These figures come from NHANES, the survey the CDC uses to track the health of the US population. Participants are measured in person at a mobile examination center, standing barefoot against a wall-mounted stadiometer, rather than being asked to report their own height. The same basics apply at home, so if you want to compare yourself to these figures, it helps to measure your height accurately first.
About the data on this page. Adult figures and percentile tables come from the CDC’s most recent anthropometric report, covering August 2021–August 2023. That report groups children into two-year age bands, so the single-year figures in the children’s tables below come from the CDC’s previous report, covering 2015–2018, which is the most recent source published by single year of age. Each table names its source.
It is important to note that these numbers describe adults of all ages, from 20 to over 80. Because older Americans are shorter on average, younger age groups run taller than the national figure, as the next two sections show.
Average Height for Men & Women in the US
What Is the Average Height for Men in the US?
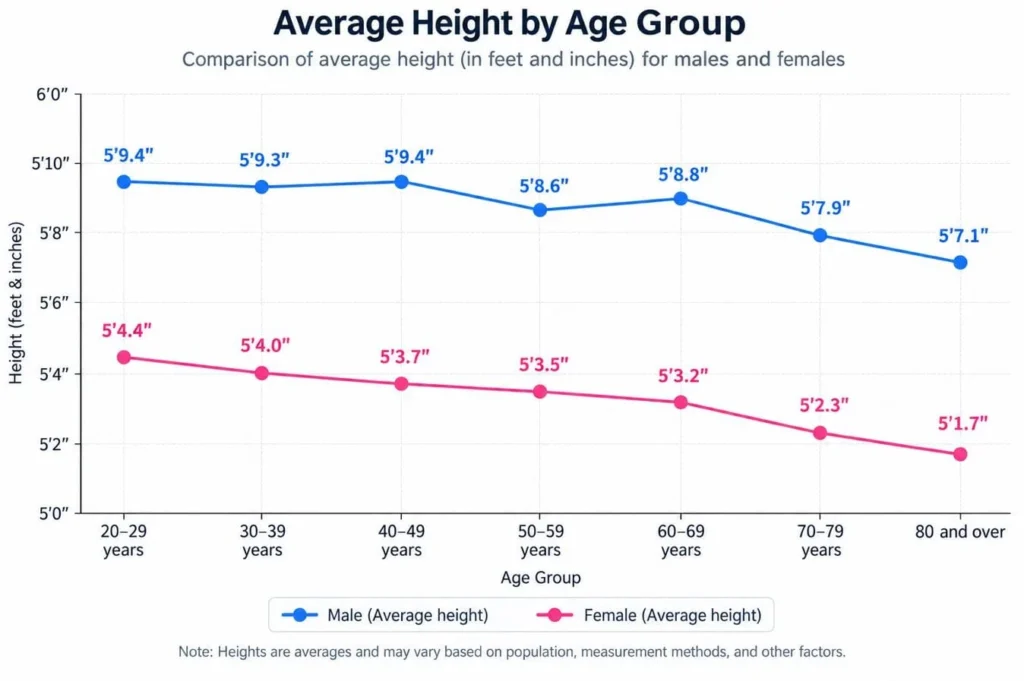
The average American man is 5’8.9″ (175.1 cm) tall, which the CDC describes as just under 5 feet 9 inches. However, that single number hides a clear pattern across age groups.
Age group | Average height | Metric |
|---|---|---|
20–29 years | 5’9.4″ | 176.3 cm |
30–39 years | 5’9.3″ | 176.1 cm |
40–49 years | 5’9.4″ | 176.4 cm |
50–59 years | 5’8.6″ | 174.3 cm |
60–69 years | 5’8.8″ | 174.7 cm |
70–79 years | 5’7.9″ | 172.4 cm |
80 and over | 5’7.1″ | 170.5 cm |
American men are tallest between 20 and 49, with barely any difference across those three decades, then get shorter from 50 onward. Two separate things cause this. First, older Americans belong to earlier birth cohorts who were shorter as young adults. Second, people genuinely lose height as they age, as spinal discs compress and posture changes. The effect shows in the table above: men aged 80 and over average 5.8 cm shorter than men in their twenties.
What Is the Average Height for Women in the US?
The average American woman is 5’3.5″ (161.2 cm) tall, about 5.5 inches shorter than the average American man. The same age pattern applies, and for women the decline is steady from the twenties onward.
Age group | Average height | Metric |
|---|---|---|
20–29 years | 5’4.4″ | 163.5 cm |
30–39 years | 5’4.0″ | 162.5 cm |
40–49 years | 5’3.7″ | 161.7 cm |
50–59 years | 5’3.5″ | 161.2 cm |
60–69 years | 5’3.2″ | 160.5 cm |
70–79 years | 5’2.3″ | 158.3 cm |
80 and over | 5’1.7″ | 156.8 cm |
Women lose height at much the same rate as men, but they start from a lower peak and live longer on average, which is why the oldest group falls furthest below the national figure. A gap of roughly 14 cm between the sexes is typical of populations worldwide, not something specific to the United States.
Where Does Your Height Rank in the US?
A height percentile shows what share of the US population you are taller than. For American men, 5’9″ sits at the 50th percentile — the median is 5’9.0″, so this is as close to average as a round number gets. Six feet is the 85th percentile, meaning about 15% of US men reach that height or more. For American women, 5’7″ is the 89th percentile.
The tables below show where any height falls among American adults aged 20 and over.
Height percentiles for American men
| Height | Metric | Percentile | Taller than | What it means |
|---|---|---|---|---|
| 5’4″ | 162.6 cm | 6th | 6% | Short |
| 5’5″ | 165.1 cm | 10th | 10% | Short |
| 5’6″ | 167.6 cm | 16th | 16% | Below average |
| 5’7″ | 170.2 cm | 26th | 26% | Slightly below average |
| 5’8″ | 172.7 cm | 38th | 38% | Slightly below average |
| 5’9″ | 175.3 cm | 50th | 50% | Average |
| 5’10” | 177.8 cm | 63rd | 63% | Slightly above average |
| 5’11” | 180.3 cm | 76th | 76% | Above average |
| 6’0″ | 182.9 cm | 85th | 85% | Tall |
| 6’1″ | 185.4 cm | 91st | 91% | Tall |
| 6’2″ | 188.0 cm | Above 95th | Over 95% | Much taller than average |
| 6’3″ | 190.5 cm | Above 95th | Over 95% | Much taller than average |
Median (50th percentile): 175.2 cm / 5’9.0″
Height percentiles for American women
| Height | Metric | Percentile | Taller than | What it means |
|---|---|---|---|---|
| 4’10” | 147.3 cm | Below 5th | under 5% | Much shorter than average |
| 4’11” | 149.9 cm | 6th | 6% | Short |
| 5’0″ | 152.4 cm | 11th | 11% | Below average |
| 5’1″ | 154.9 cm | 19th | 19% | Below average |
| 5’2″ | 157.5 cm | 31st | 31% | Slightly below average |
| 5’3″ | 160.0 cm | 44th | 44% | Average |
| 5’4″ | 162.6 cm | 57th | 57% | Average |
| 5’5″ | 165.1 cm | 70th | 70% | Slightly above average |
| 5’6″ | 167.6 cm | 81st | 81% | Above average |
| 5’7″ | 170.2 cm | 89th | 89% | Tall |
| 5’8″ | 172.7 cm | Above 95th | Over 95% | Much taller than average |
| 5’9″ | 175.3 cm | Above 95th | Over 95% | Much taller than average |
Median (50th percentile): 175.2 cm / 5’9.0″
We estimate percentiles between the CDC’s published breakpoints by linear interpolation. For children and teenagers, percentiles depend on both age and sex, so a single table cannot cover them. You can check your child’s exact height percentile using our CDC-based calculator.
Why Do Sources Quote Different US Average Heights?
If you search for American height figures, you will find both 175 cm and 177 cm quoted as the national average. Both are correct. They answer different questions.
| Source | Men | Women | What it measures |
|---|---|---|---|
| CDC NHANES, adults 20+ | 175.1 cm | 161.2 cm | Every adult aged 20 and over |
| NCD-RisC, 19-year-olds | 176.9 cm | 163.3 cm | Young adults at peak height |
| CDC growth chart, age 20 | 176.8 cm | 163.3 cm | US reference population at peak height |
The all-adult figure includes Americans in their seventies and eighties, who were shorter as young adults and have since lost height with age. Averaging them pulls the national figure down by roughly 1.7 cm. The peak-height figures exclude them, which is why they run higher.
Notice that the CDC growth chart value at age 20 and the NCD-RisC figure for 19-year-olds agree to within 0.1 cm. Two independent datasets, built from different surveys for different purposes, landing on the same number is a useful sign that both are sound.
A third reason for small differences is simply which survey cycle a source used. The CDC’s 2015–2018 data put the average American man at 69.0 inches; its August 2021–August 2023 data put him at 68.9 inches. Women measured 63.5 inches in both. Differences of a tenth of an inch between cycles are normal survey variation, not real change in the population.
There is a fourth reason figures disagree, and it matters when reading state-level rankings.
NHANES sends people to a mobile examination center and measures them. The Behavioral Risk Factor Surveillance System (BRFSS), which is the source for almost every “average height by state” table online, asks people over the phone. Most people overestimate their own height by half an inch to a full inch, so any figure built from self-reported data runs about 1 to 2 centimeters tall and should be read as indicative rather than exact.
Average Height for Boys by Age in the US
The table below shows two figures for each age, because two are in circulation and they are not the same thing.
The growth chart median is the height of a boy who has just turned that age, taken from the CDC growth charts used by pediatricians. The NHANES average covers every boy measured during that year of life, so it averages children who are 12 years 0 months with children who are 12 years 11 months. During growth years, when boys can gain 7 cm or more annually, that difference alone accounts for 2 to 7 cm.
Age | Growth Chart Median | NHANES Average |
|---|---|---|
2 years | 2’10.2″ (86.9 cm) | 2’11.9″ (91.1 cm) |
3 years | 3’1.5″ (95.3 cm) | 3’3.1″ (99.2 cm) |
4 years | 3’4.4″ (102.5 cm) | 3’5.5″ (105.4 cm) |
5 years | 3’7.0″ (109.2 cm) | 3’8.3″ (112.4 cm) |
6 years | 3’9.6″ (115.7 cm) | 3’10.5″ (118.0 cm) |
7 years | 4’0.0″ (122.0 cm) | 4’1.6″ (126.1 cm) |
8 years | 4’2.4″ (128.1 cm) | 4’3.9″ (131.8 cm) |
9 years | 4’4.6″ (133.7 cm) | 4’5.7″ (136.4 cm) |
10 years | 4’6.6″ (138.8 cm) | 4’7.6″ (141.1 cm) |
11 years | 4’8.6″ (143.7 cm) | 4’10.4″ (148.3 cm) |
12 years | 4’10.8″ (149.3 cm) | 5’0.6″ (153.9 cm) |
13 years | 5’1.6″ (156.4 cm) | 5’4.4″ (163.6 cm) |
14 years | 5’4.6″ (164.1 cm) | 5’6.9″ (170.0 cm) |
15 years | 5’7.0″ (170.1 cm) | 5’8.0″ (172.7 cm) |
16 years | 5’8.3″ (173.6 cm) | 5’8.0″ (172.6 cm) |
17 years | 5’9.0″ (175.3 cm) | 5’8.9″ (174.9 cm) |
18 years | 5’9.4″ (176.2 cm) | 5’9.1″ (175.5 cm) |
19 years | 5’9.5″ (176.6 cm) | 5’9.3″ (176.1 cm) |
Growth chart medians: CDC 2000 Growth Charts. NHANES averages: CDC NHANES 2015–2018, the most recent CDC report published by a single year of age.
The two columns converge after age 16, once growth slows and the difference between a 16-year-old and a 16-and-a-half-year-old stops mattering.
For a precise figure by year and month, use our height percentile calculator.
Average Height for Girls by Age in the US
American girls follow a different timetable from boys, growing earlier and finishing sooner. The table uses the same two measures explained above: the growth chart median for a girl who has just turned that age, and the NHANES average across the full year.
Age | Growth Chart Median | NHANES Average |
|---|---|---|
2 years | 2’9.6″ (85.4 cm) | 2’11.3″ (89.7 cm) |
3 years | 3’1.1″ (94.2 cm) | 3’2.1″ (96.9 cm) |
4 years | 3’3.8″ (101.0 cm) | 3’5.2″ (104.6 cm) |
5 years | 3’6.5″ (108.0 cm) | 3’8.1″ (112.1 cm) |
6 years | 3’9.3″ (115.0 cm) | 3’11.0″ (119.3 cm) |
7 years | 4’0.0″ (121.8 cm) | 4’0.7″ (123.7 cm) |
8 years | 4’2.3″ (127.8 cm) | 4’3.1″ (129.8 cm) |
9 years | 4’4.4″ (133.1 cm) | 4’5.7″ (136.5 cm) |
10 years | 4’6.4″ (138.2 cm) | 4’8.0″ (142.3 cm) |
11 years | 4’8.8″ (144.3 cm) | 4’11.4″ (150.8 cm) |
12 years | 4’11.6″ (151.5 cm) | 5’0.7″ (154.3 cm) |
13 years | 5’1.9″ (157.3 cm) | 5’2.1″ (157.7 cm) |
14 years | 5’3.2″ (160.5 cm) | 5’3.5″ (161.2 cm) |
15 years | 5’3.7″ (161.9 cm) | 5’3.0″ (160.0 cm) |
16 years | 5’4.0″ (162.6 cm) | 5’3.7″ (161.7 cm) |
17 years | 5’4.1″ (162.9 cm) | 5’3.9″ (162.4 cm) |
18 years | 5’4.2″ (163.1 cm) | 5’3.9″ (162.3 cm) |
19 years | 5’4.3″ (163.3 cm) | 5’3.5″ (161.2 cm) |
Growth chart medians: CDC 2000 Growth Charts. NHANES averages: CDC NHANES 2015–2018, the most recent CDC report published by a single year of age.
Girls enter their growth spurt roughly two years earlier than boys. Because of this, American girls are briefly taller than boys of the same age between about ages 11 and 13. Growth then flattens after 15, while boys continue for several more years and overtake them, producing the adult gap seen at the top of this page.
Average Height for Babies and Toddlers in the US
Before age 2, children are measured lying down rather than standing. This is called recumbent length, and it runs slightly longer than standing height would for the same child, which is why the figures below are not directly comparable to the tables above.
The figures show what American babies actually measure, from CDC survey data. Note that pediatricians assess an individual baby’s growth against the WHO Child Growth Standards rather than the CDC growth charts, because the WHO standards describe how children grow under optimal conditions worldwide.
Age | Boys (median) | Girls (median) |
|---|---|---|
Birth–2 months | 22.2 in (56.5 cm) | 22.0 in (55.9 cm) |
3–5 months | 25.4 in (64.4 cm) | 24.6 in (62.6 cm) |
6–8 months | 27.4 in (69.5 cm) | 26.6 in (67.5 cm) |
9–11 months | 28.7 in (73.0 cm) | 28.1 in (71.5 cm) |
1 year | 31.9 in (81.1 cm) | 31.6 in (80.2 cm) |
Source: CDC NHANES 2015–2018 (Vital Health Stat 3(46), Table 17), median recumbent length. The CDC’s 2021–2023 report covers ages 2 and over only.
From age 2 onward, children are measured standing, and the boys’ and girls’ tables above take over. The switch from lying down to standing is worth about 0.8 cm at age 2, so a child measured both ways will look slightly shorter standing.
Growth in the first two years is faster and more variable than at any later age, which is why the bands above are months wide rather than years.
Which US State Has the Tallest People?
Montana ranks as the tallest state for men in the most widely cited analysis of CDC survey data, at about 70.7 inches (179.6 cm). Hawaii ranks shortest at around 69.0 inches (175.3 cm), with New Mexico and California also toward the lower end.
These state figures come from the CDC’s BRFSS survey, which relies on self-reported height. That inflation is why even the shortest state appears to match the national measured average: the state numbers are useful for comparing states against each other, not against measured national data.
The range is also narrow. Across all 50 states, average male height varies by less than two inches, roughly 175 to 180 cm. Compare that to the global range, which spans about eight inches between the shortest and tallest national averages, and the state differences look minor. Tall states tend to cluster in the northern plains, which researchers generally attribute to population ancestry and historically strong childhood nutrition rather than anything specific to the region itself.
How Does US Height Compare to Other Countries?
American men rank above the global average but outside the tallest group. Men in the Netherlands average close to 184 cm, while national averages in parts of South and Southeast Asia and Central America fall below 165 cm.
Country comparisons use a different measure from the figures on this page, since international datasets record height at age 19 rather than across all adults. For the full country-by-country picture, see our average height by country guide.
Why Has US Height Stopped Increasing?
American height rose steadily for most of the twentieth century, then leveled off. CDC data shows no significant change in mean adult height between 1999 and 2016. Researchers point to several factors behind both the rise and the plateau.
1. Genetics
Genetics sets the range a person can reach, but it cannot explain change across a few generations, since the gene pool does not shift that quickly. It is the constant, which is why the factors below do the explaining.
2. Childhood Nutrition
Nutrition during childhood, particularly protein and micronutrient intake in the early years, has a strong effect on final height. Much of the twentieth-century increase reflects improved diets.
3. Healthcare Access
Illness during the growing years can permanently interrupt growth. Better childhood healthcare removed many of those interruptions.
4. Demographic Change
The composition of the US population has shifted over recent decades. Because average height varies between population groups, changes in that mix affect the national figure independently of whether any single group is growing taller. How much of the plateau this explains is still debated.
Several Asian countries have continued to gain height while the United States has not. South Korea is the clearest case, where average height rose sharply over the same period the US flattened.
Frequently Asked Questions
The average height in the US places men just under 5’9″ and women at 5’3.5″. Those numbers have barely moved in twenty-five years, after a century of steady gains — the CDC’s two most recent surveys differ by a tenth of an inch.
Averages describe populations, not individuals. A percentile is more useful than an average for understanding any single person’s height, and natural variation across several inches in either direction is entirely normal. For children and teenagers, where age matters month by month, a height percentile calculator will give a more meaningful answer than any average can.
Data sources
Adult figures come from the CDC’s most recent survey. Children’s and infant figures come from the previous survey, which is the most recent one CDC published by single year of age.
- Fryar CD, Gu Q, Afful J, Carroll MD, Ogden CL. Anthropometric reference data for children and adults: United States, August 2021–August 2023. National Center for Health Statistics. Vital Health Stat 3(50). 2025. — adult averages by age group and adult percentile tables (Tables 7 and 8)
- Fryar CD, Carroll MD, Gu Q, Afful J, Ogden CL. Anthropometric reference data for children and adults: United States, 2015–2018. National Center for Health Statistics. Vital Health Stat 3(46). 2021. — children’s heights by single year of age (Table 7) and infant recumbent length (Table 17)
- CDC 2000 Growth Charts, Stature-for-Age. National Center for Health Statistics. — growth chart medians by exact age
- NCD Risk Factor Collaboration (NCD-RisC). — international comparison figures
- WHO Child Growth Standards, Length/Height-for-Age. World Health Organization. — mentioned as context; no figures on this page are drawn from it
- CDC Behavioral Risk Factor Surveillance System (BRFSS), 2017, as compiled by World Population Review. — state-level figures, self-reported