
Height Percentile Calculator for Girls and Boys (Ages 2–20)
Use this height percentile calculator to see how your child’s height compares with other children in the United States. It works for girls and boys aged 2 to 20 and is based on the CDC growth charts used by US pediatricians.
Height Percentile Calculator
Based on official CDC growth chart data (ages 2–20)
Source: CDC 2000 Growth Charts (Stature-for-Age, National Center for Health Statistics). Age is taken as completed years and months, and the mid-point of the reported month is used for the reference lookup, per CDC guidance. For general reference only — not a substitute for a pediatrician's assessment.
A height percentile shows how many children out of 100 of the same age and gender are shorter than your child. A boy at the 70th percentile, for example, is taller than 70 out of 100 US boys his age.
How to Use the Height Percentile Calculator
Choose your child’s gender. Girls and boys grow on separate CDC growth curves, so each child is compared only with US children of the same gender.
Add age in years and months, from 2 years 0 months to 20 years 0 months. Including the months gives a more precise result, since children grow quickly at every stage.
Type height in feet and inches or in centimeters. Use a standing height taken without shoes, ideally the measurement from your child’s last checkup.
See the height percentile, z-score, and average height for your child’s age. Results appear instantly, and we don’t store anything you enter.
How to Read Your Child’s Height Percentile
A height percentile is a ranking, not a grade. The 50th percentile is the median: half of US children of the same age and gender are shorter, and half are taller.
Percentile | Meaning |
|---|---|
95th | Taller than 95 out of 100 children of the same age and gender |
90th | Taller than 90 out of 100; tall for their age |
75th | Taller than 75 out of 100; above average |
50th | Average height for that age |
25th | Taller than 25 out of 100; below average |
10th | Taller than 10 out of 100; small for their age |
5th | Taller than 5 out of 100; shorter than most children their age |
The z-score expresses the same result in standard deviations from the average. A z-score of 0 equals the 50th percentile, +1 is about the 84th percentile, and −1 is about the 16th. Pediatricians rely on z-scores for very tall or very short children, where percentiles bunch closely together.
How Do Girls and Boys Grow Differently?
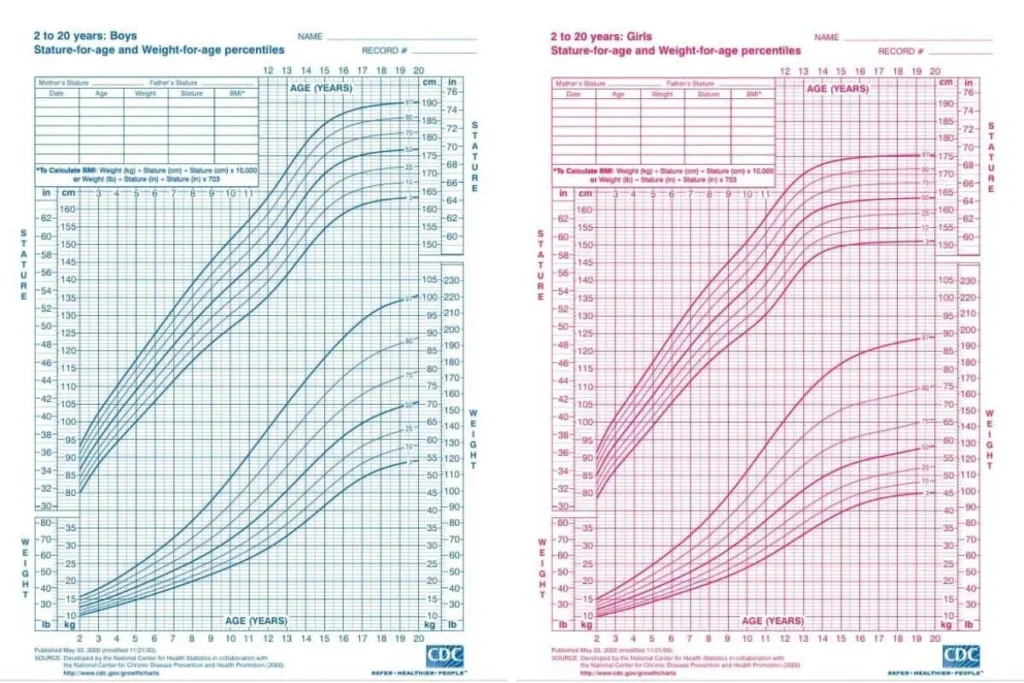
The two growth curves are close in early childhood and separate during puberty.
Girls: girls usually go through their growth spurt between ages 10 and 14 and reach close to adult height by 15 or 16. The average US girl is 33.6 inches tall at age 2, 4’6″ at age 10, and 5’4″ at age 20.
Boys: boys usually go through their growth spurt between ages 12 and 15 and keep growing until about 17 or 18. The average US boy is 34.2 inches tall at age 2, 4’7″ at age 10, and just under 5’10” at age 20.
Because girls start puberty earlier, many girls are as tall as or taller than boys their age between 11 and 13. This is normal and shows up clearly in the percentile results.
What Is a Normal Percentile for Height?
A height between the 5th and 95th percentile is considered normal, and many pediatricians use a wider range of the 3rd to 97th percentile. Most healthy children stay close to the same percentile as they grow.
Talk to your pediatrician if your child’s height:
Short-term changes during puberty are common. Early developers often move up a percentile range for a few years, while late developers often move down before catching up.
What Percentile Is My Height? (Adults)
If you are over 20, enter your age as 20 years 0 months to get an estimate. Most people reach their final height by 18 to 20, so the end of the CDC chart is a close match for US adults.
At age 20, the average height on the CDC chart is just under 5’10” for men and 5’4″ for women. On this chart, a 5’10” man is at about the 55th percentile and a 5’10” woman is at about the 99th. The CDC charts are based on US national surveys from the 1960s to the 1990s and describe young adults at peak height.
In the CDC’s latest national survey (NHANES, August 2021–August 2023), which covers all US adults aged 20 and over, the averages are lower: just under 5’9″ for men and 5’3.5″ for women, because older adults are shorter on average. On that measure, a 5’10” man is at about the 63rd percentile. For current figures by age group and full adult percentile tables, see our guide to average adult height in the US.
How Does This Calculator Work?
This CDC height percentile calculator uses the CDC 2000 stature-for-age growth charts from the National Center for Health Statistics. The CDC and the American Academy of Pediatrics recommend these charts for US children and teens aged 2 to 20.
It applies the CDC’s LMS method, which converts a child’s height into a z-score for their exact age and gender and then into a percentile. Age is calculated at the midpoint of the month entered, following CDC guidance. Results match the CDC’s published percentiles to within 0.005 percentile points.
All calculations run in your browser. No height, age, or other information is stored or sent anywhere.
Frequently Asked Questions
Related Height Tools and Guides
Sources
- Centers for Disease Control and Prevention, National Center for Health Statistics: CDC Growth Charts, Stature-for-Age, 2 to 20 Years
- Centers for Disease Control and Prevention: Growth Chart Percentile Data Files with LMS Parameters
- National Center for Health Statistics: Anthropometric Reference Data for Children and Adults, United States, August 2021–August 2023 (Vital and Health Statistics, Series 3, No. 50)
Disclaimer: This calculator is for informational purposes only and is not a substitute for medical advice. Consult your pediatrician with any questions about your child’s growth.